Data Visualization
Metabase
Metabase is an open-source software for nonprofits (NPOs) that provides a powerful interface that can be used by non-techies.
With Metabse, NPO’s can:
- Use Metabase as a donor management tool: trace donor information, track donation amounts, track campaign success rates gaining insight into donor behaviour, and make informed decisions on future fundraising strategies.
- Monitor program outcomes: Track the progress of work and measure the impact rate of work, that is, the number of people served from each program or project.
- Optimise operational performance: Evaluate their operational performance, such as financial management or volunteer engagement, by tracking key metrics and identifying areas for improvement.
- Customise data sets: Align the insights that are most important to an organisation's mission.
- Share data with stakeholders: Harmonise transparency and create custom reports with Metabase to share with stakeholders, board members, and program partners.
- Spark fresh queries: Ask questions about their data and get immediate answers. Confidence in an NPO’s mission is always backed by the thorough data they are able to provide from their efforts.
Note: NPOs can either choose to self-host it on their own server, or install it on a managed instance.
Metabase is an ideal tool for NPO’s, due to its easy-to-use interface, cost-effectiveness, and quick deployability. It allows NPOs to quickly create dashboards and reports that can help them better understand their data and make meaningful reports to their funders.
Features of the tool
- Unlimited charts
- Unlimited dashboards
- Connects to 20+ database types
- Use 15+ visualisations
- Schedule updates via email or Slack
Benefits for NPO’s
- Metabase allows NPO’s efficiently analyse their data, saving time and resources that can be redirected towards their core mission.
- With Metabase, NPO’s can make data-driven decisions, using insights from their data to inform fundraising, program development, and operational strategies with the help of 15+ dashboard visual representations.
- By leveraging Metabase to schedule updates via email or Slack, allowing them to stay up to date with their data without having to manually check it, this scheduling feature can help them stay on top of their data, ensuring they are always aware of the most current information.
Reasons to use Metabase
- It's an open-source tool.
- Quick setup and user-friendly.
- Flexible user interface.
- Interlinks to other database sources.
- A low code/no code tool that eliminates the requirement for developers.
- Create interactive dashboards & custom visualisations.
- Data segmentation to see the data from different perspectives.
Supported Database
Metabase allows NPOs to easily connect and explore data stored in multiple databases and data warehouses. NPOs can quickly and securely access, analyse, and learn from their data, no matter where it is stored.
Officially supported database (Connectors built by the Metabase team and available on all editions. Fully supported by Metabase for users on paid plans.)
- Amazon Athena
- BigQuery( Google Cloud Platform)
- Druid
- H2
- MongoDB (Version 4.2 or higher)
- MySQL (version 5.7 or higher, as well as Maria DB version 10.2 or higher)
- Oracle
- PostgreSQL
- Presto
- Redshift (Amazon Web Services)
- Snowflake
- Spark SQL
- SQL Server
- SQLite
- Vertica
Community Data Source Connectors(Connectors built by the Metabase community and only available on self-hosted and open-source editions for licensing reasons. Not supported by Metabase.)
- Cube
- Dremio
- DuckDB
- Hydra
- Spark Databricks
- Teradata
Graphical Representations
Fig. 1. The Metabase home page.
The Metabase open-source home page provides an overview of the software's features and capabilities, as well as links to documentation, community resources, and downloads.
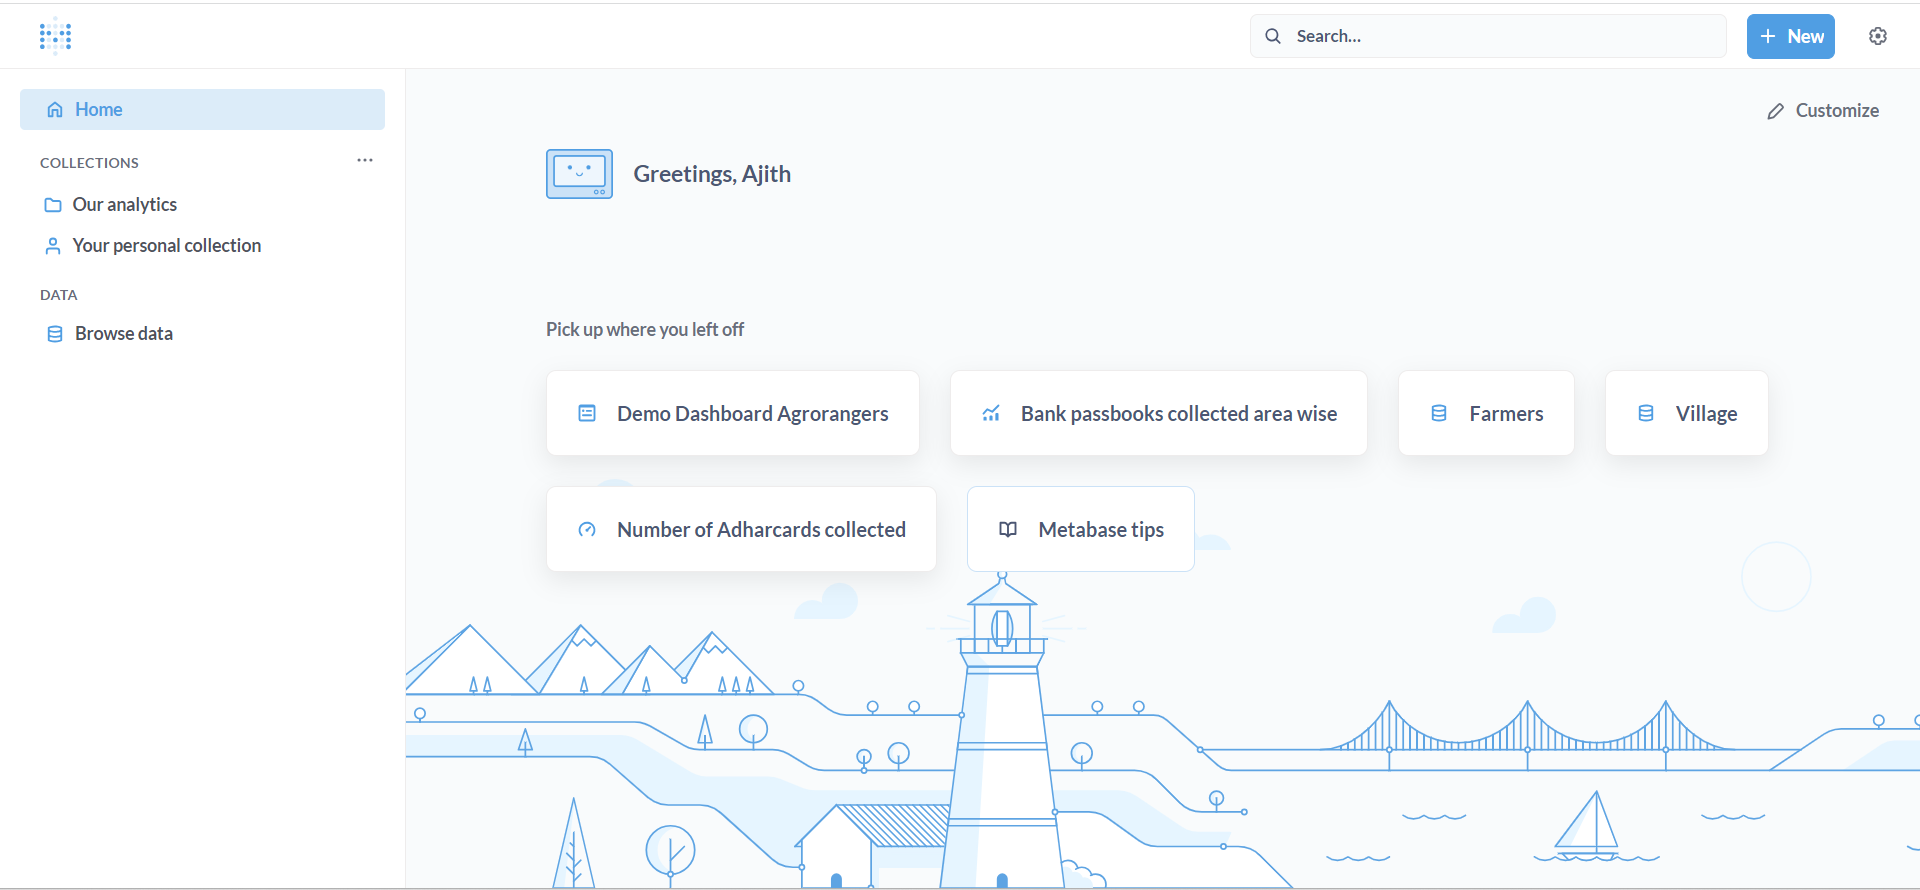
Fig. 2. Metabase Dataset interface
The Dataset interface can be incredibly helpful for NPOs. It allows them to easily and quickly access data in a way that is organised and intuitive. The Metabase data set interface allows users to easily create, save, and share custom queries and data visualisations, empowering non-technical users to explore and analyse their data without requiring specialised knowledge or training.
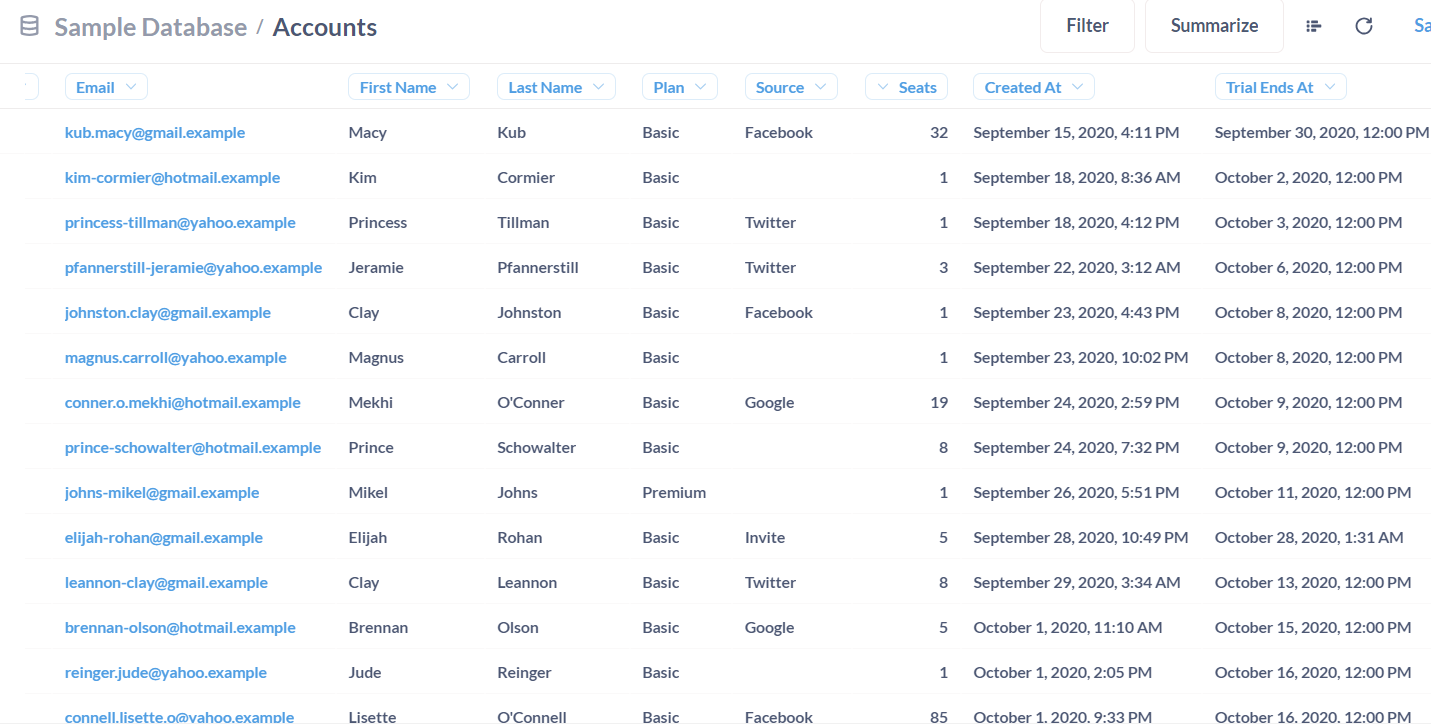
Fig. 3. Select from 15 different chart types to visualise results:
15 different chart types offer a powerful way to view impactful results. By using these charts, users can quickly identify trends, patterns, and outliers in their data. NPOs can easily compare different data sets side by side, allowing them to make more informed decisions. Additionally, these charts are interactive and customizable, so users can tailor the charts to their specific needs. This allows them to quickly and easily gain insight into their data and make the most of their resources.
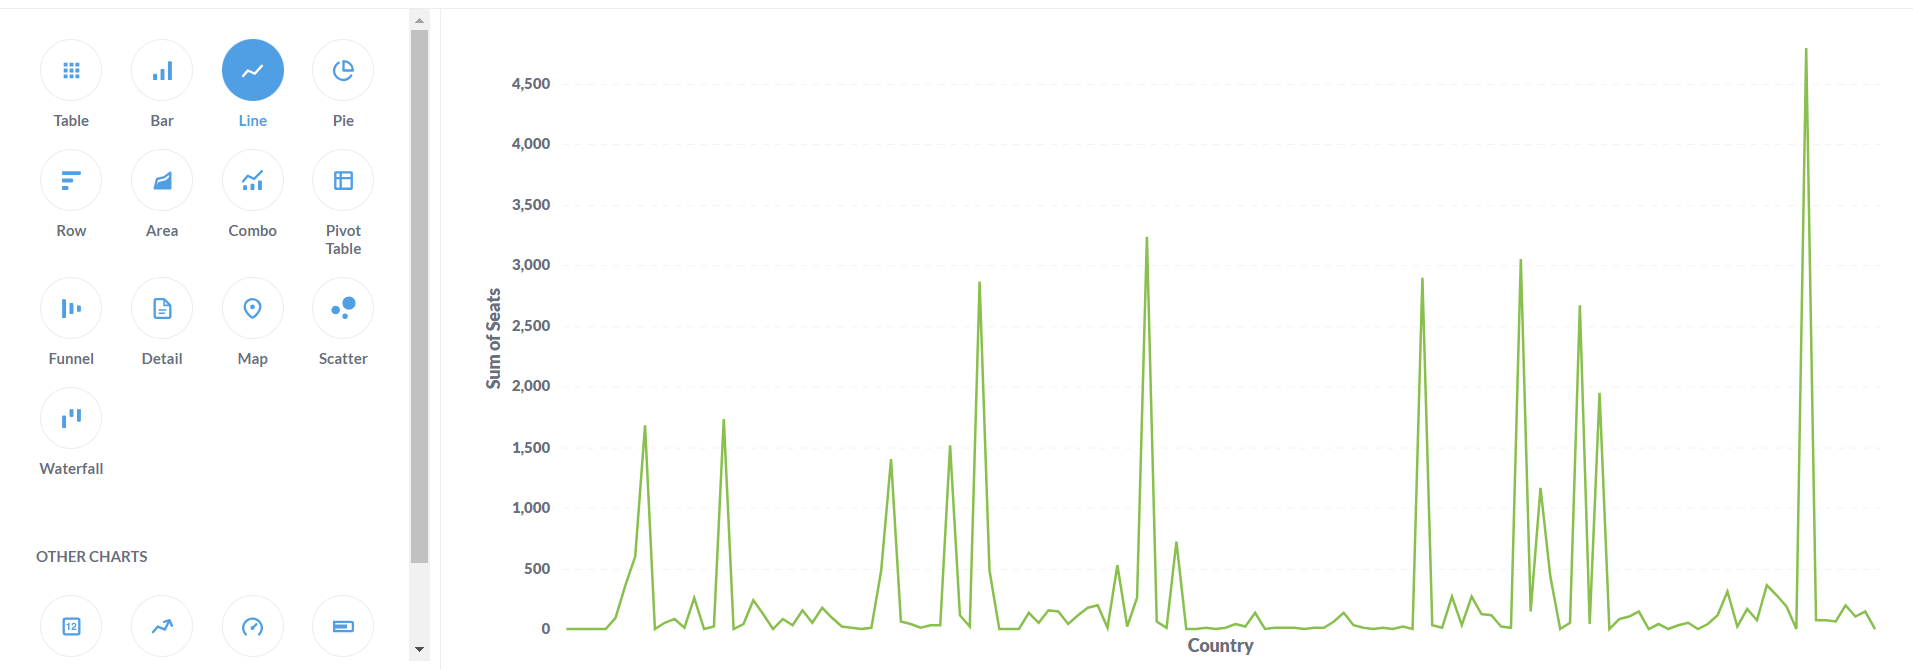
Fig. 4. Metabase Bar chart view:
An ideal for NPO’s to visualise performance at an organisation level. It displays the total count or sum of values grouped by a certain attribute, such as month, age, group, location, etc. This makes it easy to get an overview of how the organisation is performing in each category. The bars can also be coloured to help quickly identify highs and lows. With a Metabase bar chart, it's simple to get a quick snapshot of the performance.
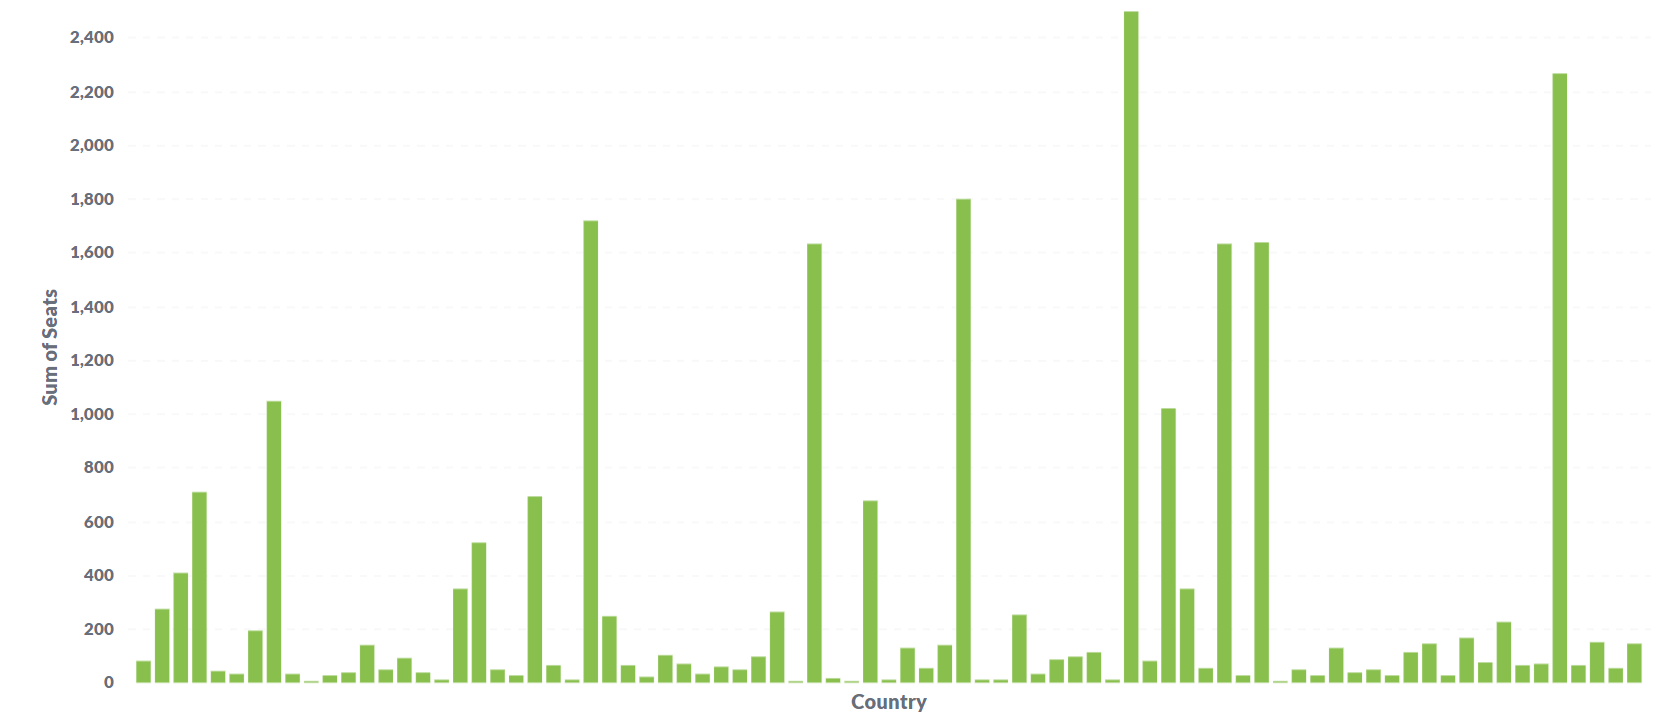
Fig. 5. Live dashboard view:
Live dashboard feature helps to track performance helping NPOs stay on top of their projects or campaigns. With this chart, they can identify key metrics such as donations, volunteers, and program results which can be monitored in real time creating less buffer time, allowing them to strategies immediately.
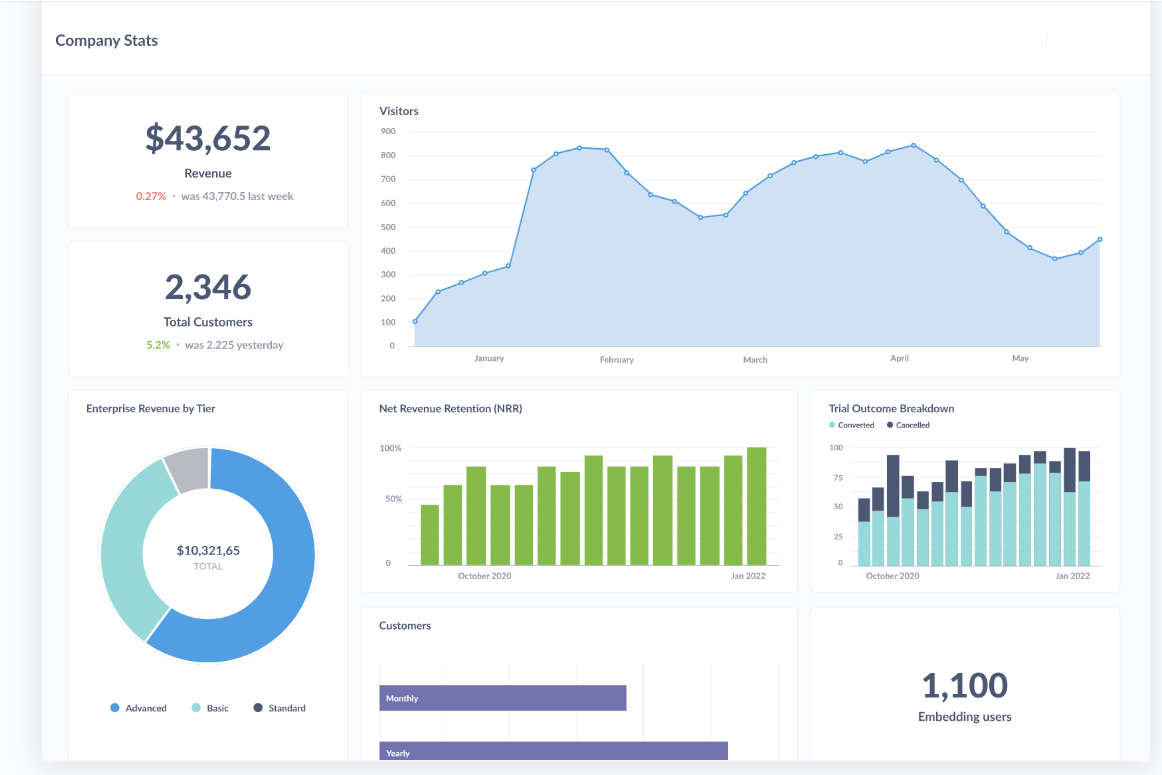
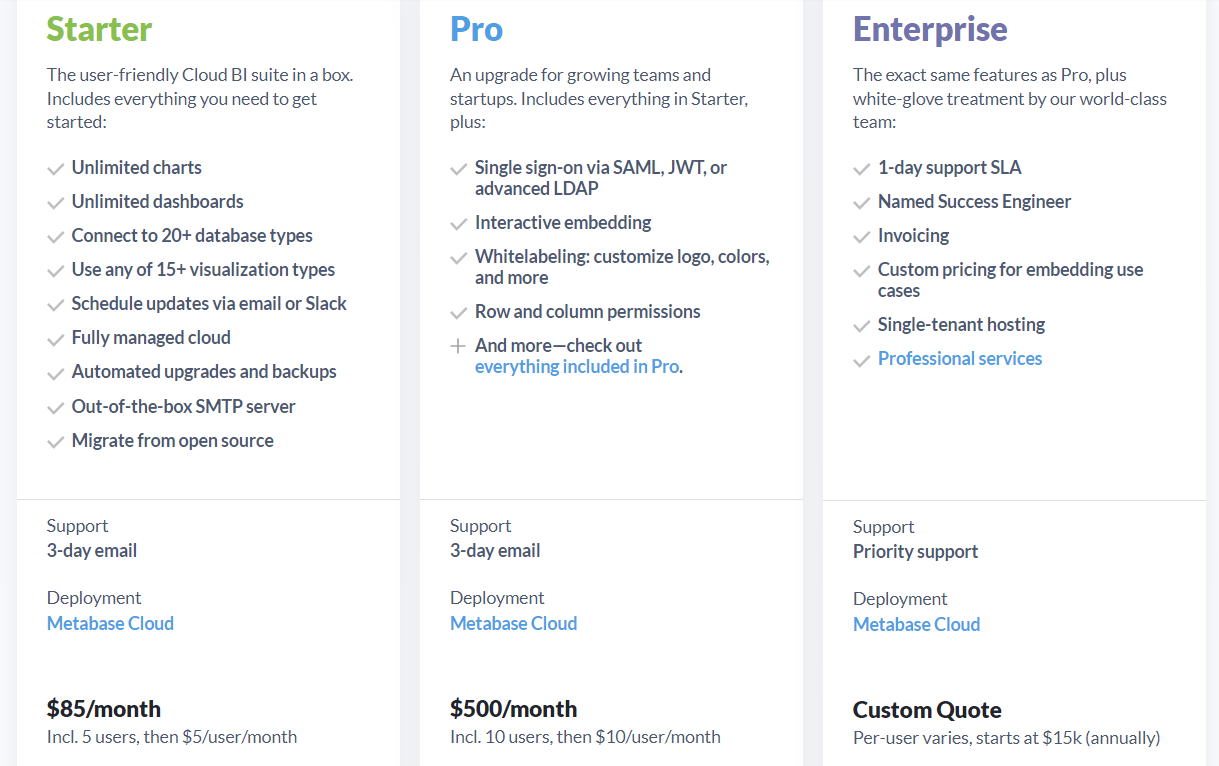
Fig. 6. Pricing
Metabase open source project has a large and active community of users, developers, and contributors. It has been downloaded more than 30,000 times and has more than 324 contributors on Github. It also has a thriving community of more than 7,000 users on its Discourse forum.
Limitations
- Lacks dedicated customer support
- Slow data rendering if multiple users access it simultaneously
- Advanced dashboarding capabilities
- Working with more data causes significant delay and latency
Conclusion
In conclusion, Metabase is an ideal tool due to its easy-to-use interface, cost-effectiveness and quick deployability. It allows organisations to create dashboards and reports that can help them better understand their data and make meaningful reports to their funders or new donors. It is available in both Community and Enterprise Editions, so that NPOs can choose the version that best suits their needs.
BIRT
Business Intelligence Reporting Tool (BIRT) provides a platform to create data visualisations, nonprofits can pull and combine data from many different data sources (databases, files, Java, Javascript, web services, etc) and use this data for reporting (textual) and charting (visual). This allows nonprofit organisations to quickly and efficiently generate insights from their data that can be used to inform their decision making processes. Additionally, BIRT can help nonprofit organisations to create reports that are tailored to their specific needs, saving them time and money. The BIRT tool can address a wide range of reporting needs which are implemented in a streamlined process.
Features
- Extensibility.
- Data Access.
- Create additional items to report.
- Numerous chart types through plug-ins.
- BIRT supplies several APIs that can use many network applications for generating and viewing reports. (Example: Java EE)
-
It can provide a wide variety of properties for formatting report items. The properties are based on the W3C CSS (Cascading Style Sheet) format.
Benefits for NPOs
Changed on website to:
- BIRT consists of two primary components: a visual report designer for creating BIRT designs and a runtime component.
- NPOs can use BIRT to create custom reports that are easy to understand and visually appealing, allowing them to communicate their impact to stakeholders and funders more effectively.
- BIRT is a free and open-source tool, which helps NPOs reduce their costs on data analysis tools.
- It automates the reporting processes, saving time and increasing efficiency. This enables the team to focus on other critical tasks, such as fundraising and program delivery.
- By providing accurate and timely data, BIRT helps NPOs make better decisions that are based on solid evidence.
- It can also help them track their activities and measure their impact, making them more accountable to their stakeholders and funders.
- It provides NPOs with the ability to analyse data in real-time, allowing them to make informed decisions based on accurate information.
- The tool also includes a charting engine that is both fully integrated into the BIRT designer and can be used autonomously to incorporate charts into an application.
- BIRT designs are persisted as XML and can access many different data sources like JDO datastores (Java Data Objects), JFire Scripting Objects, POJOs (Plain Old Java Objects), SQL databases, web services, and XML.
- NPOs can create guides, build and edit data sources and data sets.
- NPOs can create data sources and data sets, and implement serverless mapping, web.xml settings, parameters, directory structure, tag libraries, and attributes to enhance their reporting capabilities.
Tools Installation Setup
- Designer Install.
- Framework Designer Install.
- JDBC Drivers.
- Updating a BIRT Installation.
- Deploying to a Java EE Server.
- Installing BIRT language packs on windows & common problems.
Conclusion:
In conclusion, BIRT (Business Intelligence and Reporting Tools) can provide significant benefits to NPOs by helping them collect, analyse, and report on data. BIRT can be used for a wide range of activities, including financial reporting, donor management, program evaluation, impact reporting, grant reporting, and marketing and communications. By using BIRT, NPOs can improve data analysis, create better reports, increase efficiency, and make informed decisions based on solid evidence. BIRT can also help NPOs increase accountability to their stakeholders and funders by tracking activities, measuring impact, and demonstrating the effectiveness of their programs and services. Overall, BIRT is a powerful tool that can help NPOs achieve their goals and create positive change in their communities.